Analysing 12 years of Amazon purchases (and how you can too!)
Like many people, I purchase… pretty much everything from Amazon, especially since the pandemic. In this post I’ll analyse my own purchasing habits, and provide a template so you can do the same!
All of the calculations used in this post are available in a spreadsheet, feel free to look at how the data is calculated.
Getting your data
First, you need to export your purchase history from Amazon. The URL for this varies by country, e.g. Amazon US and Amazon UK, if you’re elsewhere just change the domain to your usual Amazon domain.
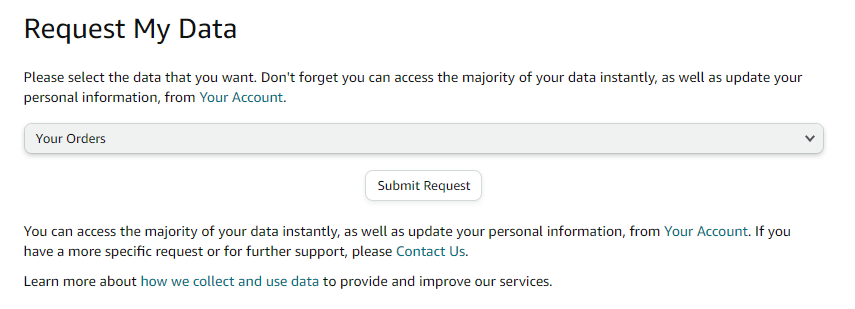
Once on data requesting page, select “Your Orders” and submit request:
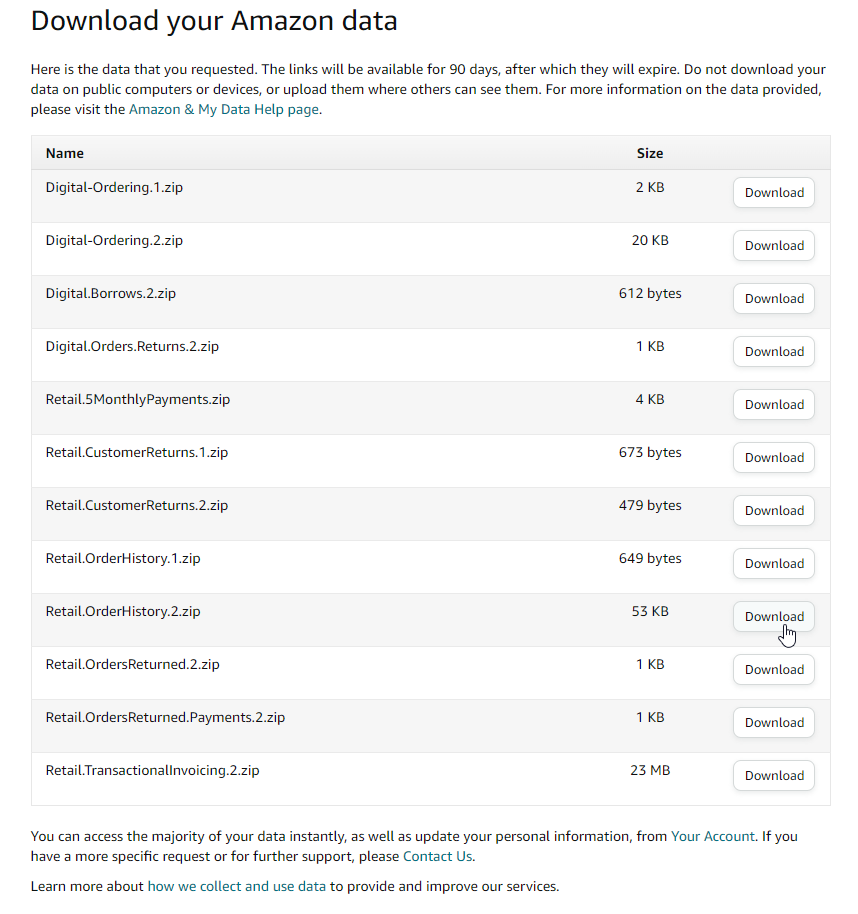
This will probably take a couple of days to compile, and you’ll receive a email when it’s done. This email will contain a link to download your data, you want Retail.OrderHistory.2.zip:
Finally unzip the downloaded file (how to unzip), and you’ll have your Retail.OrderHistory.2.csv!
Adding it to the spreadsheet
First, open up the Amazon analysis template spreadsheet.
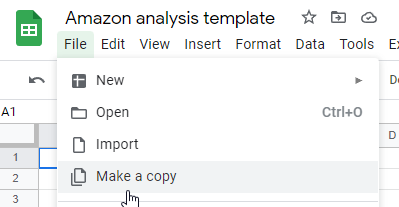
Next, click File -> Make a copy to create an editable version for yourself:
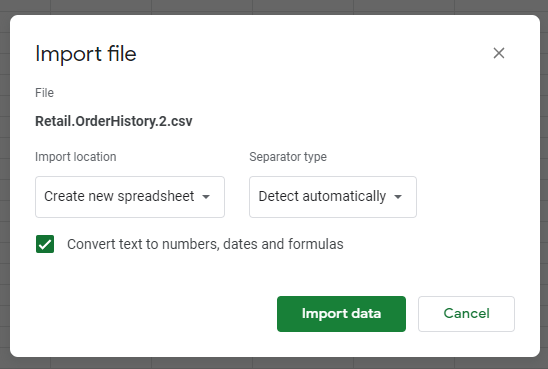
Finally, click File -> Import -> Upload tab, and pick your Retail.OrderHistory.2.csv. The default import settings should be fine:
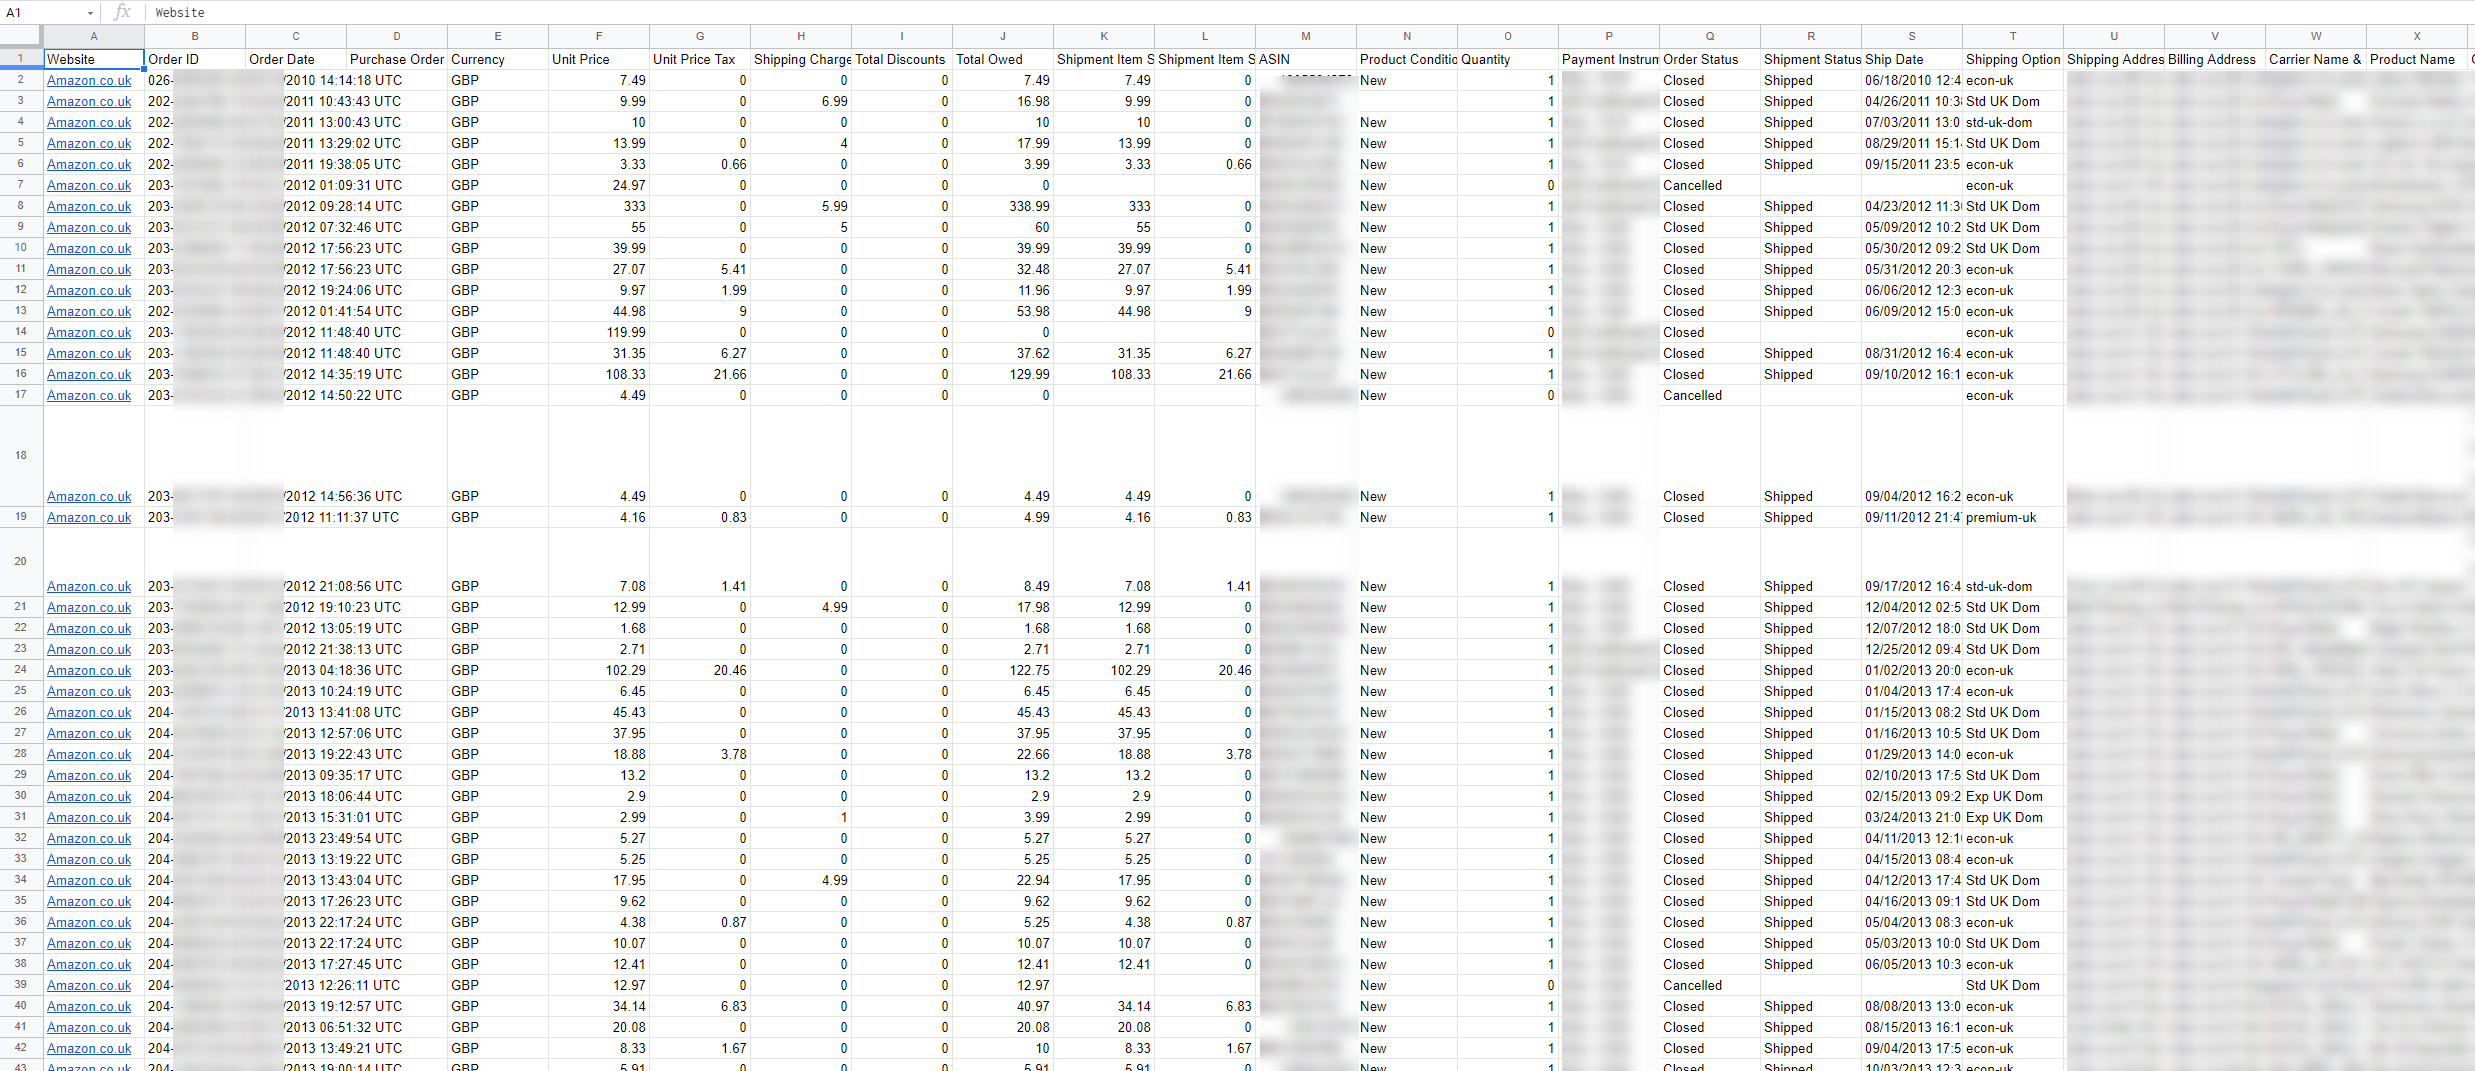
You should now have a very, very big spreadsheet containing all of your data!
In the next section I’ll analyse my own data, you can do the same by looking at your own “Calculations” sheet.
Analysing my own data
Whilst I can’t share my own spreadsheet (it contains multiple addresses, payment information, and gift messages), I can share the analysis! One more time, here’s the spreadsheet if you want to analyse your own purchases.
The total amount spent will SEEM crazy at first glance, but considering I purchase pretty much all household purchases, gifts, cat items, DIY, tech etc from Amazon, it’s not too bad.
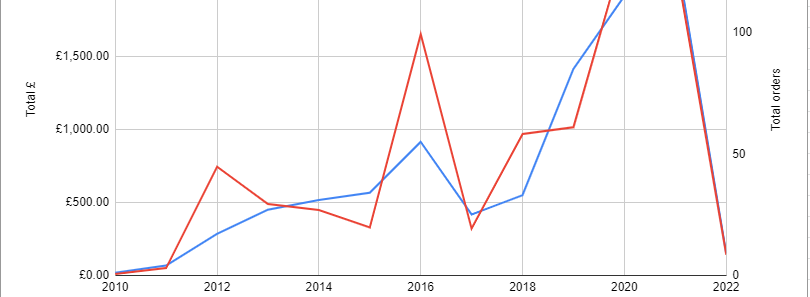
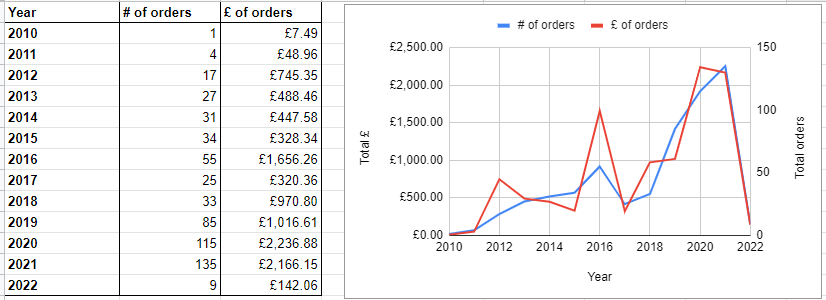
Orders by year
Nothing too unexpected here. My Amazon purchasing has steadily creeped up year over year as I’ve got older, absolutely skyrocketing during the pandemic! The spike in 2016 is due to building a new PC, and buying ~£1000 of parts / accessories.
2022 has obviously barely started, so not many purchases yet.
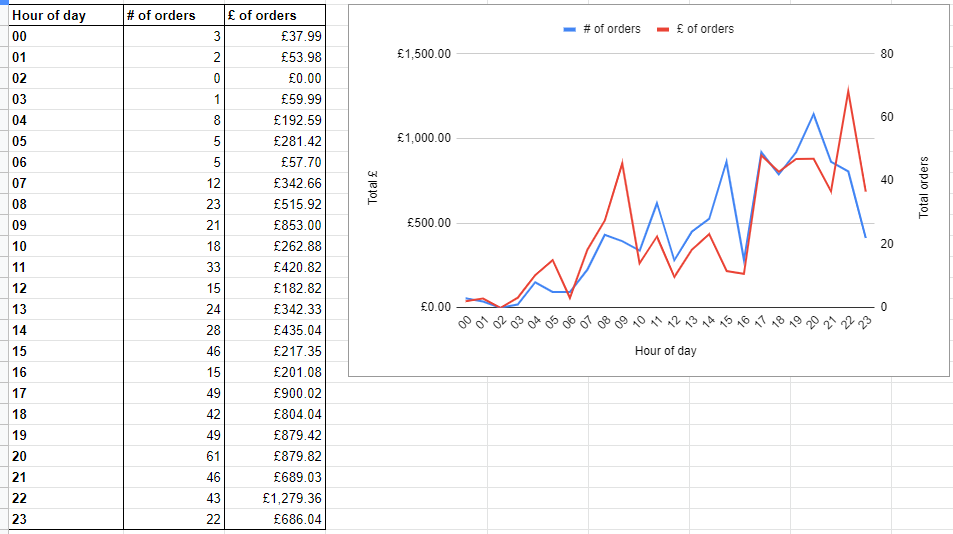
Orders by hour
The shape of this graph surprised me! Whilst I knew I mostly purchased during the evening, I have no idea what I’ve been buying in the early hours of the morning.
Not too sure what to make of the dip at 4-5PM, I guess I avoid purchases just before work ends!
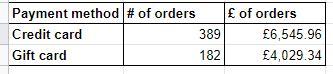
Orders by method
This reveals the underlying secret, that around 40% of my Amazon purchases aren’t actually paid for by me!
I do a few tech interviews / surveys per month, usually giving Amazon vouchers, as well as earning a few larger vouchers from competitions, work, or as gifts. I’m surprised it’s SUCH a large percentage though, I guess lots of little gift cards add up.
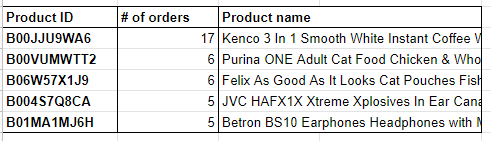
Most ordered items
No surprises here for me! My top 3 purchases are an instant coffee I drink daily, and cat food.
The 4th and 5th most purchased items are fairly cheap headphones (~£10). Before buying my beloved WH-1000XM3s, I would just buy cheap headphones that would break in a few months, hence why I seem to order so many of them!
Calculations
In case anyone is curious, I wanted to run through some of the tricky bits of the Calculations spreadsheet tab.
- All the
# of ordersand£ of ordersare justCOUNTIFandSUMIFs for the value to filter by. - The top 5 product IDs required a bit of SQL, I’m very very grateful to this StackExchange answer!
- Finally, to get the product names once I had the top 5 product IDs, I had to use
VLOOKUP. Very odd results were being returned initially, until I figured out I need to setis_sortedto false. It’strueby default, but Google recommend setting it to false!
Conclusion
Whilst I would have liked to gather proper data for each product (e.g. category, rating, etc), this would have been a far, far more complex undertaking. This simple analysis still provides some interesting insights, and can easily be expanded on. It’s also kinda fun playing around with spreadsheets, and seeing what is possible!