Analysing my Goodreads book history since 2014 (and how you can too!)
I tend to read quite a bit, and really enjoy Goodreads’ “My Year in Books”. It’s a great way to look back at the last 12 months of data, but I wanted to dive a bit deeper, and include my whole collection. Luckily, I discovered a way to do so…
Preparing the data
Getting your book information
Goodreads offers a solid set of base data by letting you export a .csv containing every book you’ve added, along with metadata such as the number of pages.
To get this file, just go to the Goodreads export page and select “Export library”. Within a few minutes you’ll be able to downloads goodreads_library_export.csv!

Optional: Enhance the data
This step is completely optional, and involves installing a program to add genre and book reread information to your data.
Feel free to skip to the next step if you’re not interested or don’t trust the software’s author (who also makes the data viewing tool later) with your login details!
- Go to the Enhance Goodreads Export codebase.
- Download
enhance_goodreads_export_gui.exe. - Run the downloaded program.
- Click “export file” and select the
.csvfile downloaded previously. - Enter your Goodreads email and password.
- Click “start processing”.
This will then connect to Goodreads as you, fetch book genres & your reading history, and save it back to the file.
It takes 5-6 seconds per book, and my collection of ~1000 books took around 90 minutes. Once it’s done, your .csv file will now include additional data, ready for the final step!

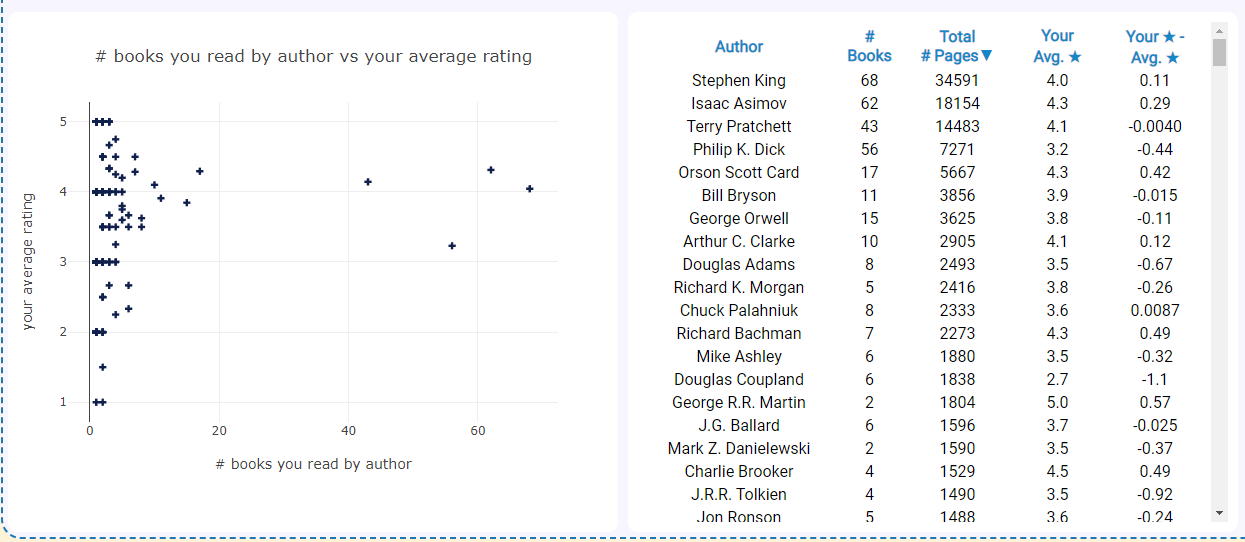
Viewing the data
Unlike my YouTube analysis, someone has created a tool to analyse this data and present it in lots of interesting charts!
The site Bookstats by Paul Klinger is evidently a passion project that has been made public, luckily for us. After uploading our goodreads_library_export.csv, we get a page full of 18(!) graphs!
There’s plenty to dive into here, but in the next section I’ll highlight a few charts I found particularly interesting.
Data highlights
Overall stats
At the very top of the page Bookstats tells me that my 838 read books contain a staggering total of 262k pages, and nearly 71 million words!
Using the assumption of 1 page per minute, pretty reasonable when factoring in rereading tricky paragraphs, pausing to think etc, we can get an estimate of total time spent. I’ve spent over 180 days reading since the start of 2015! This sounds crazy, until considering that’s ~7% of my time, which actually sounds quite plausible, around 90 minutes per day.
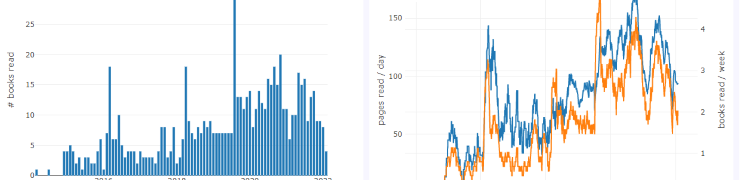
Reading frequency

As I’d expected, over the last few years I’ve gradually read more and more, with a slight dip during covid as I stopped commuting. I suspect that spike in August 2019 was working through an author’s short stories body of work, maybe Arthur C Clarke!
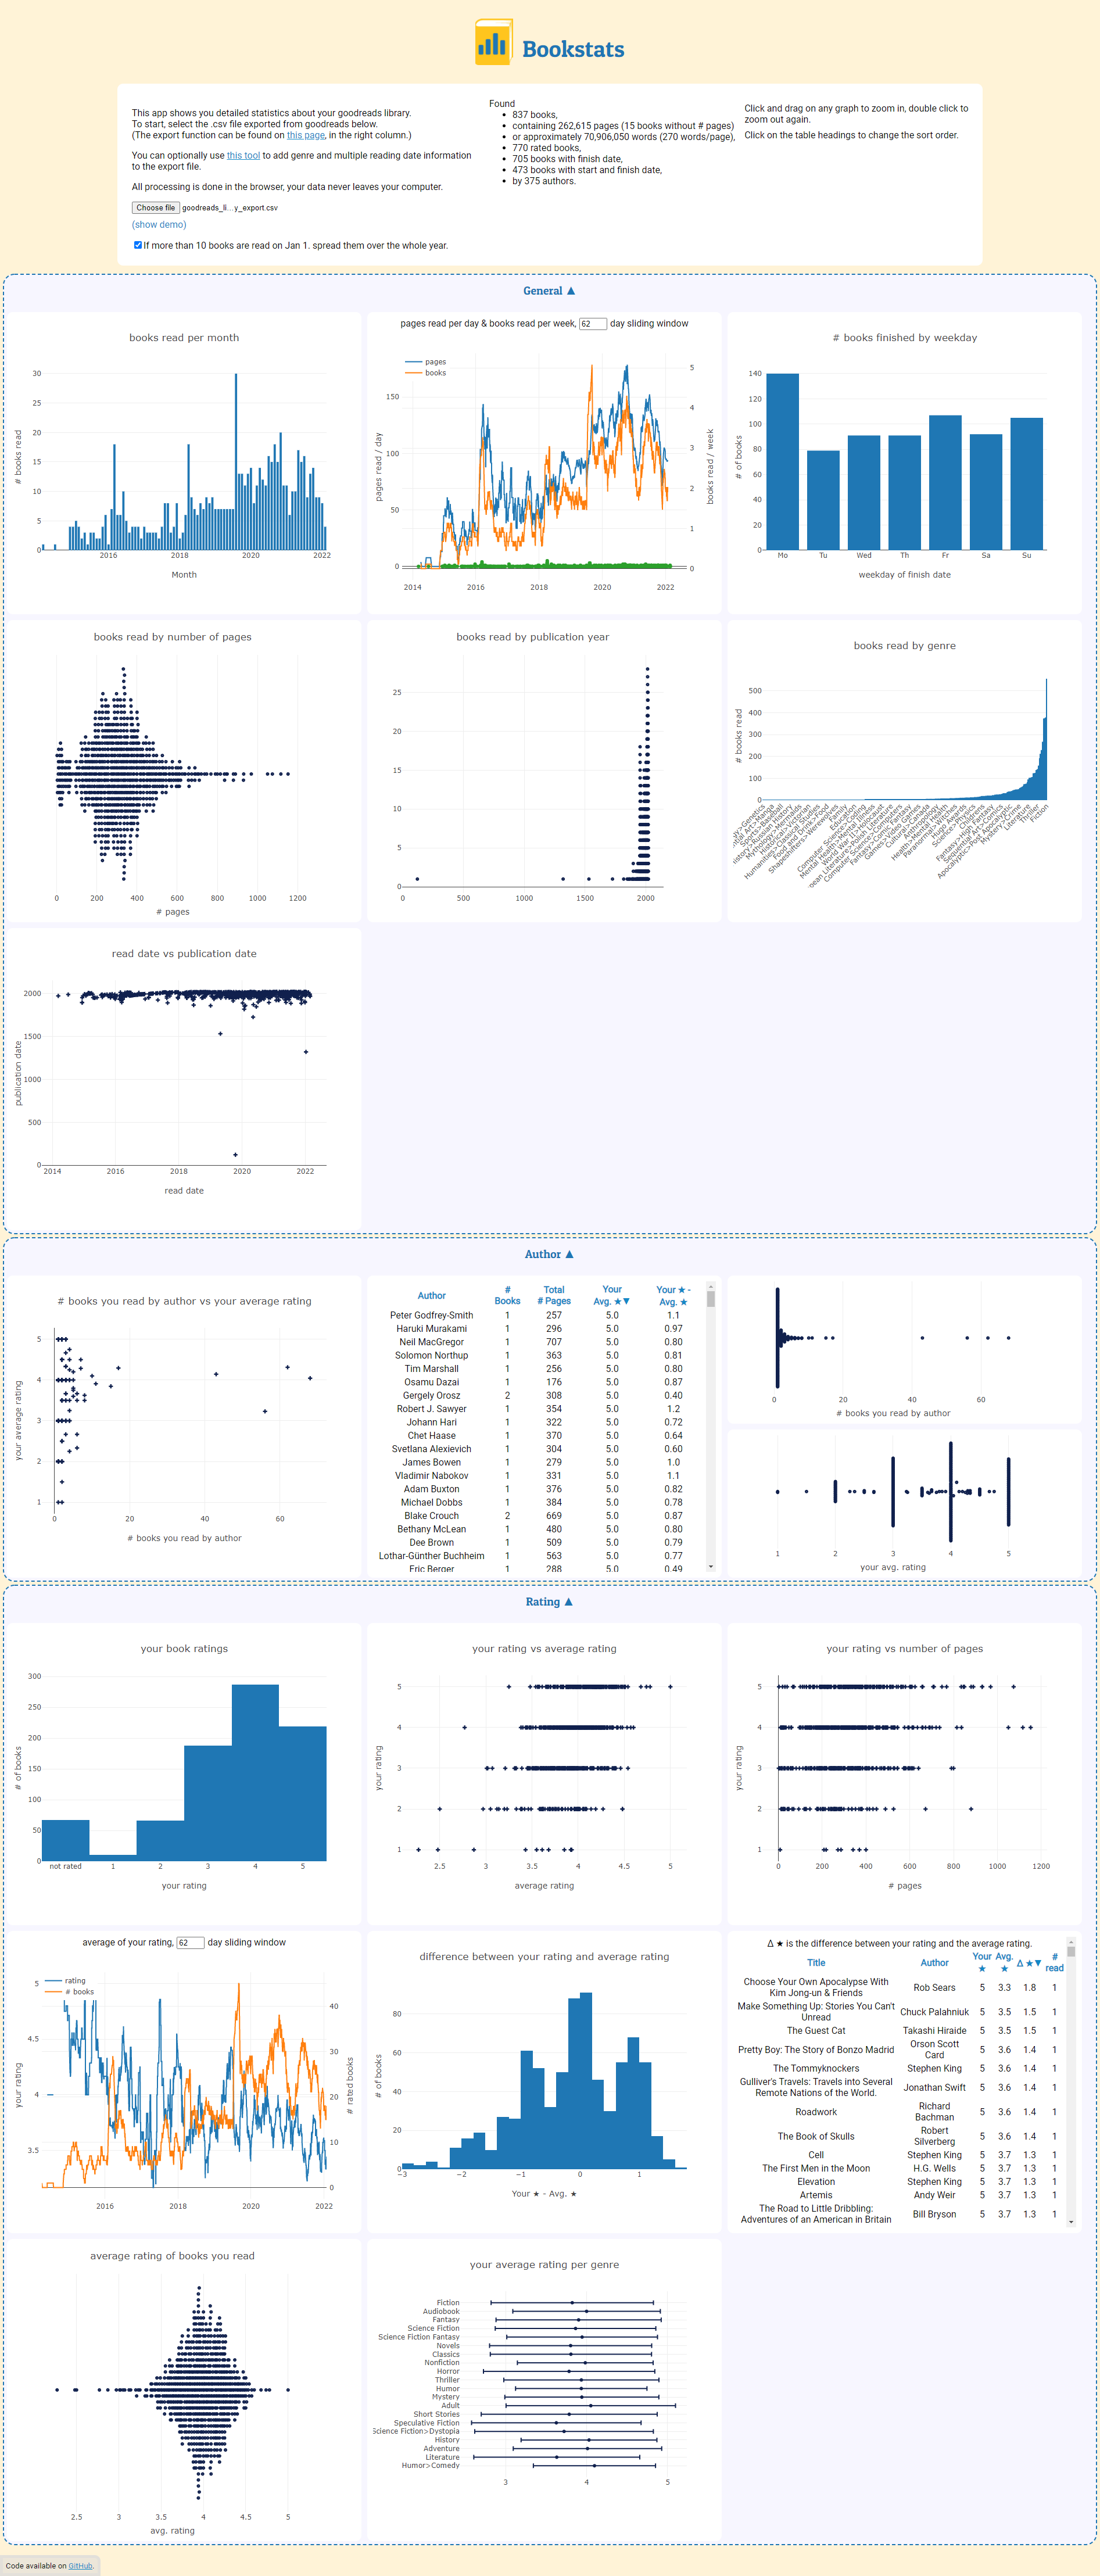
Book metadata
When looking at book length and publication year, a few outliers are very, very obvious. Book length is relatively reasonably distributed, with all of the 1000+ page epics being Stephen King’s mammoth books e.g. “It” and “The Stand”.
My book publication graph is… somewhat ruined by the outliers. Suetonius’ 121 AD book The Twelve Caesars makes the graph almost unreadable, with Dante’s Inferno and Machiavelli’s The Prince seemingly modern in comparison! Fortunately, you can zoom in by mousing over the chart. This showed a peak in the 1950’s for golden age scifi, then a steady increase in books as time progresses, nothing too insightful.
The “books by genre” was quite surprising, and I’m not sure how accurate the data is. Apparently my top 6 genres are “Fiction”, “Audiobook”, “Fantasy”, “Science Fiction”, “Science Fiction Fantasy”, and “Novels”. These have… quite a lot of crossover, and I’m not sure “Audiobook” is a valid genre! My actual favourite genre is easily sci fi, and I read very little fantasy, so this chart didn’t feel as accurate as the others. This is likely an issue with Goodreads’ book genre data though, and not Bookstats.
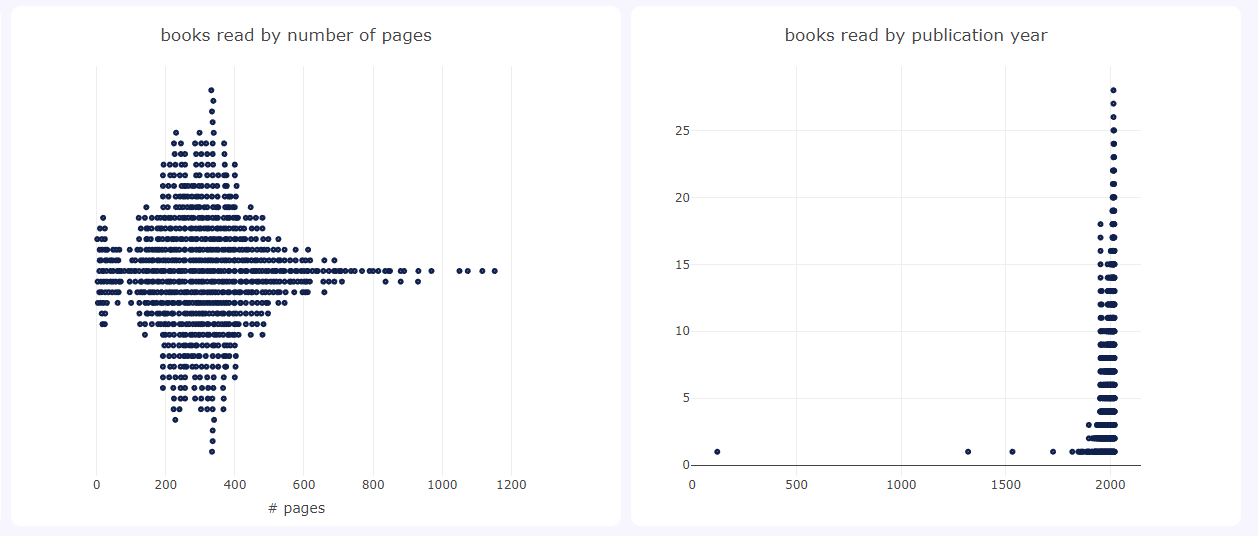
Author data
Whilst I wasn’t surprised by the authors I’ve read most (Stephen King, Isaac Asimov, Terry Pratchett, Philip K Dick), I was surprised in their ratings. With an average of 3.2/5, I barely seem to enjoy Dick’s work, yet I’ve read 56 books (well, stories… some were very short!).
The 2nd chart was interesting, comparing my average rating for an author to the Goodreads average. Amongst the popular authors that I dislike are Ernest Cline, Olaf Stapledon, and Stephen Fry!
Rating data
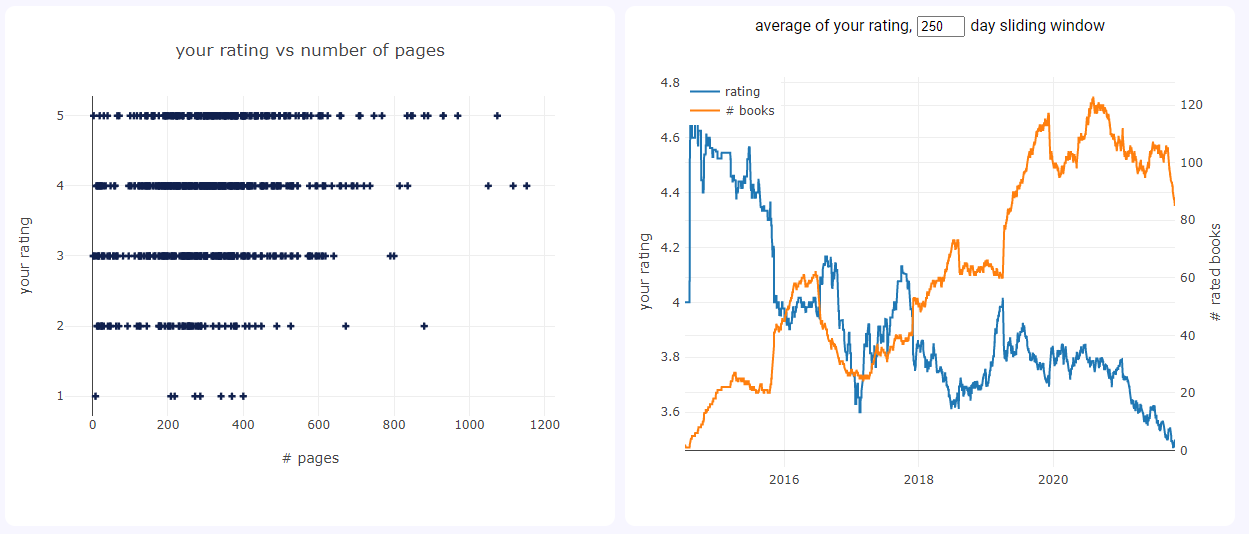
These charts highlighted a couple of things I didn’t expect. First, that I seem to have a preference for longer books, consistently rating them highly. This might be because I’m unlikely to start a large book by a new author, so these books tend to be from already trusted authors, biasing the data.
Next, my average rating has noticeably dropped (4.6 -> 3.6) as I read more books. I wonder if reading more widely has given me more context, so I’m less easily impressed by a book. OR, my conscious effort to read more than just reliably enjoyable scifi has led to reading more books that I’ve not enjoyed.
Summary
So, what did I learn? A few interesting bits of information about my rating over time, and seeing big total numbers is always nice!
More than that though, I mostly learnt that I’m so, so grateful to people who make great tools like this for free. I wish there was some kind of central list of “services to help analyse your exported data”, to provide graphs like this for all services.
One more time, thanks to Bookstats for doing all the hard work for me!