
Analysing your Netflix viewing history: How much have you watched, when, and how?
With Netflix’s recent changes to account sharing, I was curious how my (shared!) account had been used over the last 10 years. To do this, I made a spreadsheet, and you can analyse your viewing history with it easily too!
All of the calculations used in this post are available in a spreadsheet, feel free to look at how the data is calculated. There’s also more information on the formulas later on.
Additionally, I’ve previously provided guides on how to analyse your data from Twitch, Amazon, Google Play, YouTube, Kindle, and Goodreads!
Getting your data
Request your data
To get your data, visit Your Account page and navigate to the Download my personal information page.
On here, submit a request, and verify your email. You should receive an email in a day or so (mine took 12 hours) with a link to download.
Download your data
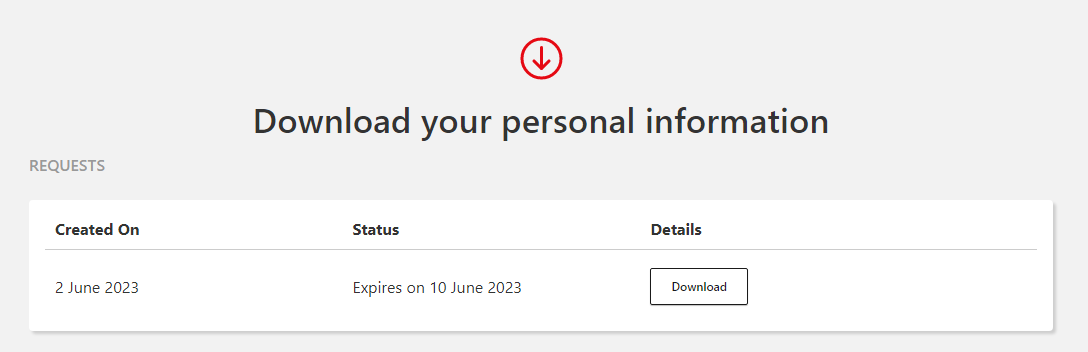
Once the email arrives, click the download link, confirm your password, and there’ll be a download button:
Once downloaded, unzip the downloaded file (how to unzip), and you’ll have all your data! Inside the unzipped netflix-report folder, navigate to CONTENT_INTERACTION, then you need ViewingActivity.csv.
Preparing your spreadsheet
Initial sheet creation
First, open up my Netflix analysis template spreadsheet.
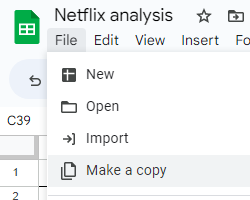
Next, click File -> Make a copy to create an editable version for yourself:
Adding your data
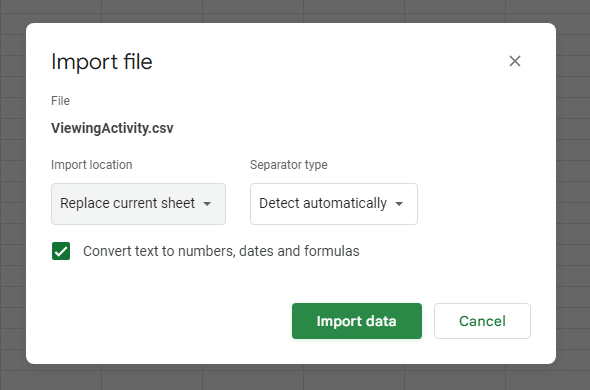
Now you’ve got a blank spreadsheet, we need to add your data! Navigate to the ViewingActivity sheet, and click File -> Import -> Upload tab, and pick ViewingActivity.csv. Make sure to change “Import location” to “Replace current sheet”, then click “Import data”:
This might take a few seconds to load, and the analysis sheet will definitely take a few more seconds to run all the formulas for the first time.
That’s it, you’re ready to look at your analysis! In the next section, I’ll analyse my data; you can do the same by looking at your own “Analysis” sheet.
Note: A reader reached out and shared that their export had the columns in a different order. Make sure to rearrange your columns so they match the example spreadsheet to enable the data analysis!
Analysing my own data
Users
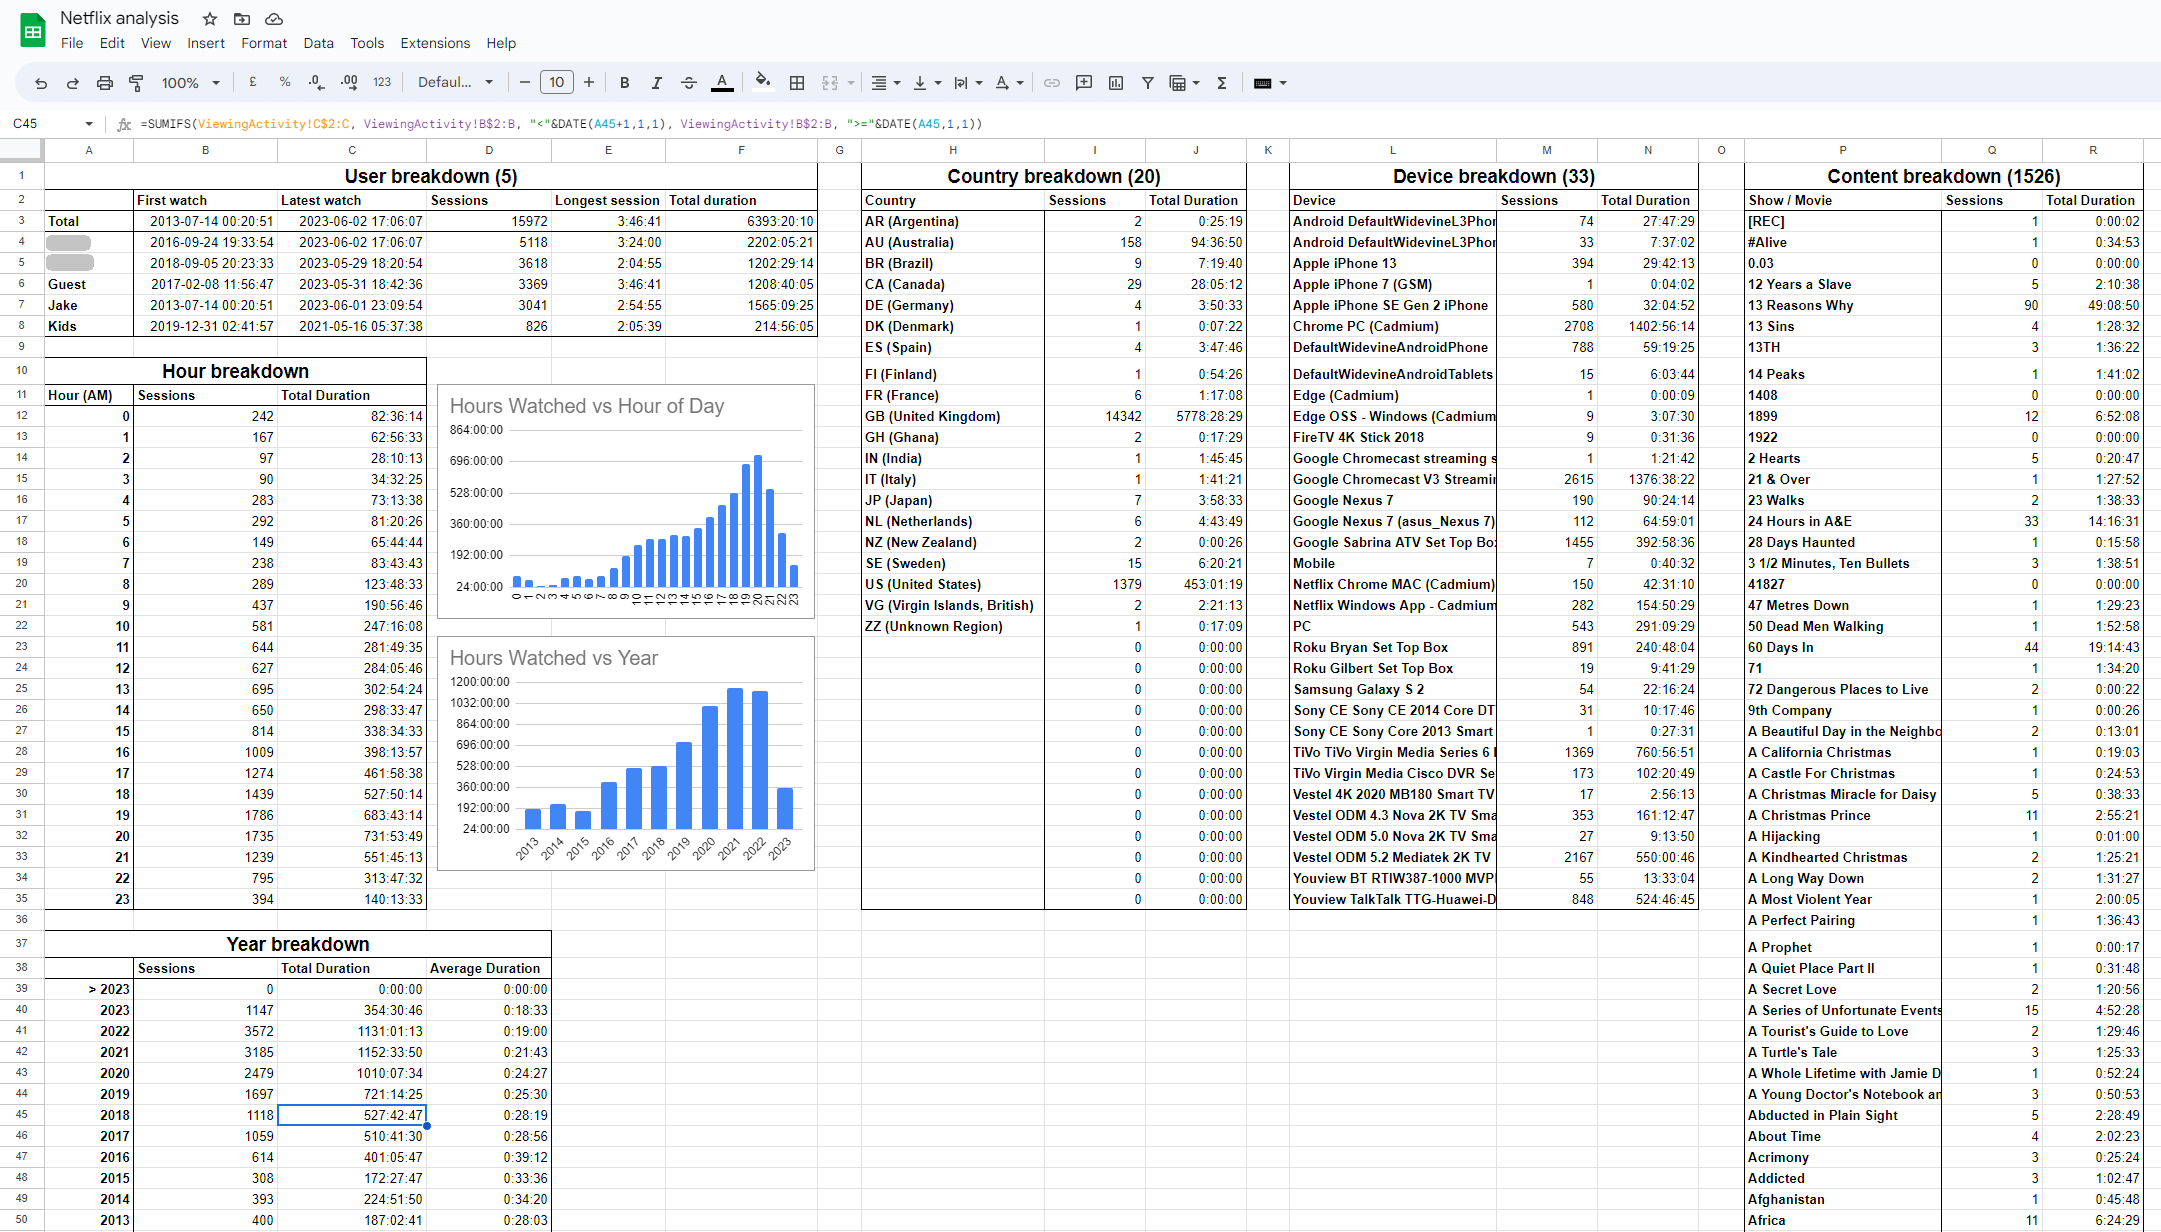
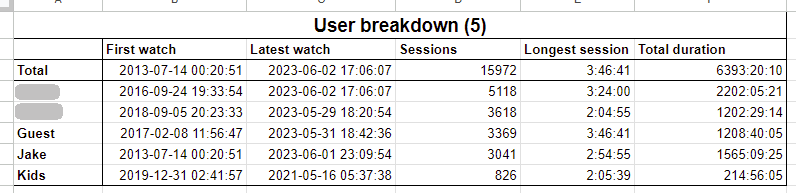
The “User breakdown” table shows Netflix stats split by profile that has watched content.
I used to watch a lot more Netflix, and had exclusive access for the first 3-4 years, so I was pretty surprised I’m only responsible for around 25% of the total watch time! It’s still 62 days of watch time, but over 10 years this is to be expected.
Most of the data is very self-explanatory, I was quite interested in seeing my first watch session was almost a decade ago, and that nobody uses the “Kids” profile anymore.
By time of day / year
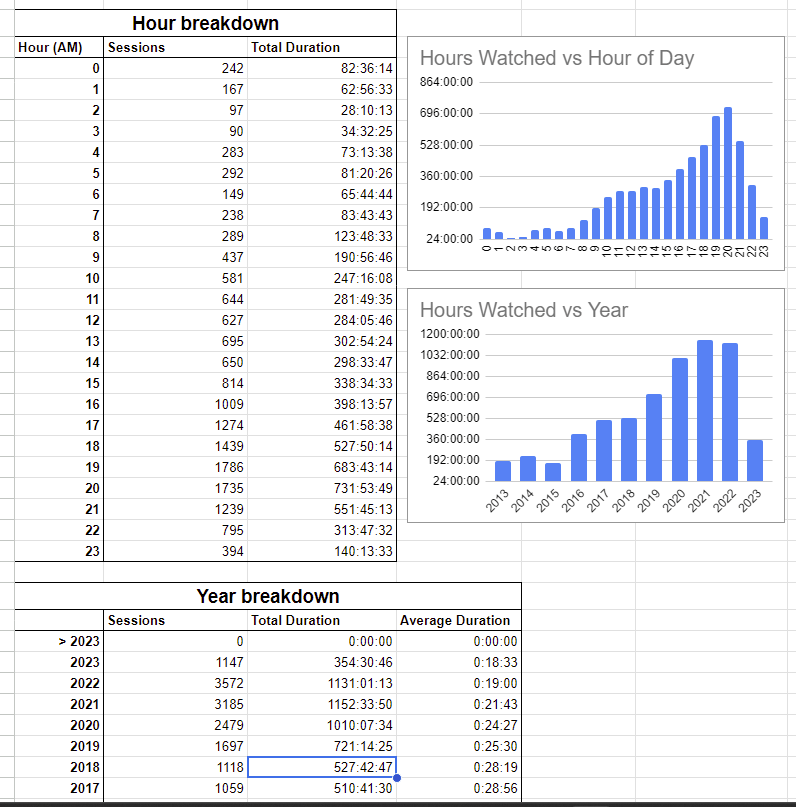
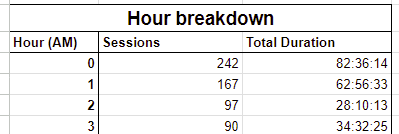
The “Hour breakdown” and “Year breakdown” tables show Netflix viewing history split by year and hour of day. Whilst these 2 data sets (and associated graphs) look suspiciously similar, it’s a coincidence!
Unsurprisingly my account has watched more and more content over the years, this is more due to my account being shared with more family members than my personal watch time actually increasing. Time of day distribution is also as expected, I often watch videos as background noise whilst working so I suspect I’ll have a smaller “evening” spike than most people.
By country / device
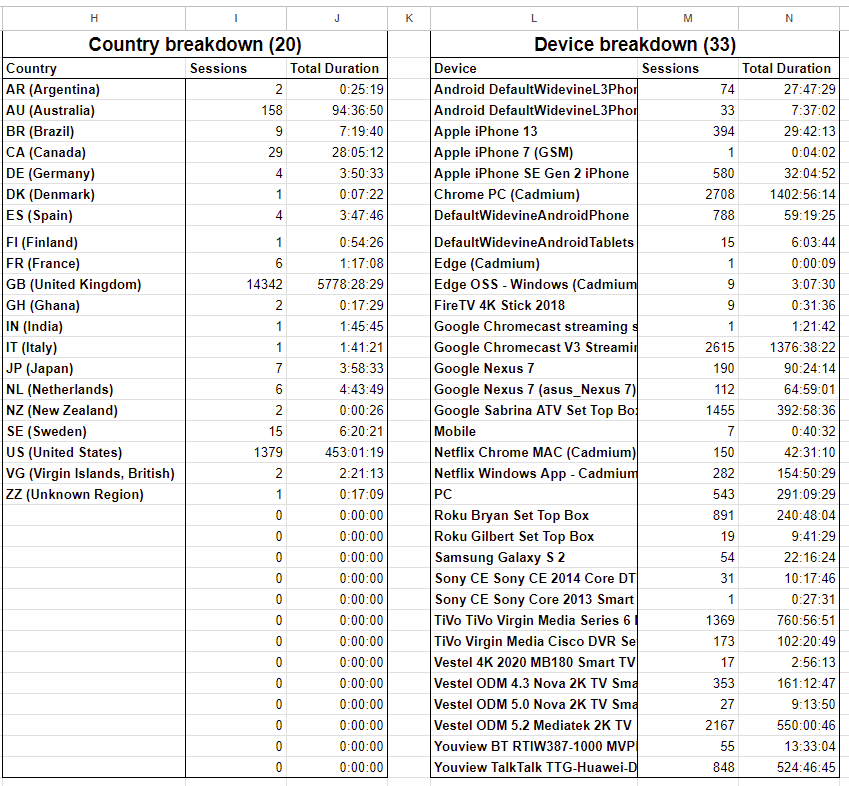
The “Country breakdown” and “Device breakdown” tables show Netflix viewing history split by countries accessed from, and devices watched on.
Okay okay, this looks a little bit suspicious… I used to have an extension that would load all countries’ Netflix libraries, hence the occasional trip to Ghana! The non-VPN data is unsurprisingly entirely US & UK based. The device information is much messier than expected. I assumed there’d be some sort of coherent system, but it seems to be all over the place. I recognise my old devices (Galaxy S2, Nexus 7!), makes me weirdly nostalgic!
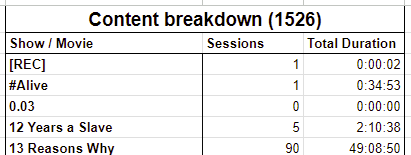
By content watched
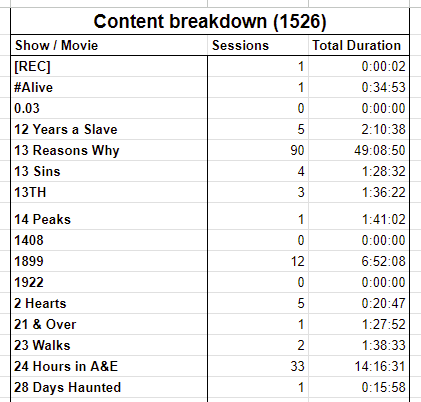
The “Content breakdown” table is a couple of thousand rows long, and lists every single show / film watched on my Netflix account.
This was by far the hardest part of this spreadsheet to write a formula for (see “finding unique substrings”), and it’s amazing how many awkward TV show names break any code. For example, the show “3%” is formatted as 0.03 and… I’ve given up fixing it! All other shows / films seem OK, let me know if any others seem broken.
Technical
As always when I make these spreadsheets, I end up having to learn plenty of new things. Here’s a few of the more useful techniques, I’m sure I’ll be needing them for the next analysis!
Adding counts to table headers
This is a small addition, but adding a row count to the table header adds a bit of utility to a usually redundant title cell:
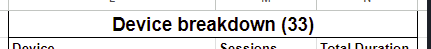
The formula for this is just basic string concatanation, with COUNTA used to count non-empty cells:
="Device breakdown ("&COUNTA(L3:L)&")"
Finding unique substrings
The “Content breakdown” table requires gathering a list of all unique shows / films watched. This requires finding all unique substrings from a massive range of data. In this case, I want to find unique values before the first :, as shows are logged in the format My Show: Season 1 Episode 1.
The full code to do this (made more readable) is:
=SORT(
    UNIQUE(
        TO_TEXT(
            INDEX(
                SPLIT(
                    FILTER(ViewingActivity!E2:E, ISBLANK(ViewingActivity!F2:F))
                , ":")
            , 0, 1)
        )
    )
)
I know, it’s a bit chaotic when seen all at once. Here’s what each bit does, from the middle outwards:
FILTER...&ISBLANK...: This fetches all titles (ViewingActivity!E2:E) that don’t have anything in column F, which is used to indicate trailers or other non-standard content.SPLIT...: This splits each title by:, separating the show name from any episode information.INDEX...: This grabs the first split value, e.g. the show’s name. Google Sheets is not zero-indexed!TO_TEXT...: This converts the value into plaintext, avoiding any numerical show titles breaking the formula.UNIQUE...: This filters all the show / film titles to be unique.SORT...: Finally, this sorts all the titles alphabetically.
Note that the session count and duration total are just basic SUMIF and COUNTIFs, used throughout the analysis sheet.
Filter rows by part of timestamp
The “Hour breakdown” table splits all viewing timestamps by the hour they took place in. I hadn’t worked with timestamps much before, and this turned out to be trickier than expected:
I’ll walk through the “Sessions” count, since “Total Duration” is just an extension of it. Here’s a formula that counts the number of events between 10AM and 11AM (new lines added for readability):
=ArrayFormula(
    COUNTIFS(
        TIME(
            HOUR(ViewingActivity!B2:B)
        , 0, 0),
    A22&":00:00")
)
Not as bad as the last formula, but still confusing. Here’s how it works, from the inside out:
HOUR...: This pulls the hour from all viewing events, e.g. “10” from “10:33:21”.TIME...: This creates a new time with the previously retrievedHOUR, and a minute & second of0. E.g. “10:00:00” from “10”.COUNTIFS...: This counts every one of these new timestamps that matches one we’ve built usingA22. For example ifA22contained “10”, we’d be matching all rows with “10:00:00”.ARRAYFORMULA...: I don’t understandArrayFormulahonestly, but it converts the count into a format that can be displayed in a cell!
Conclusion
Overall, I’m pretty happy with how the analysis went. I’d have liked to share my full viewing data, but since multiple people use the account it wasn’t possible.
I’ll avoid complaining about the changes to Netflix’s account sharing policies, since I’ve already (somewhat) acted with my wallet by reducing my plan. Since I no longer need the 4 active screens perk of the highest plan, I downgraded to save £5/mo!
Whilst analysing the content itself (e.g. genre, % of shows finished, rewatches) would have been a useful addition, it would be pretty tricky without hooking up to IMDb’s datasets. The metadata analysis itself is still pretty interesting, I was definitely surprised how much other family members use my shared account.
One last time, here’s the spreadsheet!